L’interpretazione statistica e predittiva della relazione tra la frequenza e la magnitudo alla base di un ‘semaforo dei terremoti’ recentemente testato su una sequenza sismica californiana
Roma, 9 luglio 2020 – Eseguito con successo il primo test sul “semaforo dei terremoti”, un modello messo a punto lo scorso ottobre da Laura Gulia e Stefan Wiemer del Servizio Sismologico Svizzero (SED), in grado di interpretare statisticamente in maniera predittiva la variazione del b-value, cioè del parametro che esprime la relazione tra frequenza e magnitudo dei terremoti. Tale modello è basato su analisi sistematiche di sequenze sismiche accadute in tutto il mondo per fornire una risposta in tempo reale sulla base di un codice di allerta (caratterizzato dai colori verde, arancio e rosso).
Il test, appena pubblicato sulla rivista Seismological Reseach Letters nello studio ‘Pseudoprospective Evaluation of the Foreshock Traffic-Light System in Ridgecrest and Implications for Aftershock Hazard Assessment’, e condotto da un team di ricercatori del SED e dell’Università di Bologna, Gulia e Wiemer, in collaborazione con Gianfranco Vannucci dell’Istituto Nazionale di Geofisica e Vulcanologia (INGV), si è svolto attraverso l’implementazione del modello in near-real-time, cioè a posteriori ma utilizzando i dati preliminari alla sequenza sismica californiana di Ridgecrest del luglio del 2019 che erano disponibili all’epoca in real-time.
Compito dell’INGV nello studio è stato quello di ricostruire, nelle fasi iniziali dell’analisi della sequenza, le possibili sorgenti sismogenetiche dei due eventi principali: il terremoto di magnitudo 6.4 del 4 luglio 2019 e il successivo mainshock, ovvero l’evento sismico principale, di magnitudo 7.1 del 6 luglio 2019.
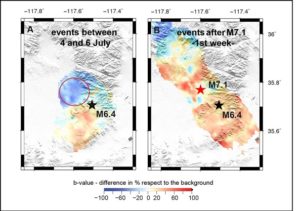
“Abbiamo analizzato la relazione tra distribuzione sul territorio e magnitudo dei terremoti, conosciuta come Gutenberg-Richter, la cui pendenza fornisce un parametro noto in sismologia come b-value, e le sue variazioni spazio-temporali sul piano di faglia – spiega Gianfranco Vannucci, ricercatore INGV che ha collaborato allo studio – Una diminuzione del b-value dopo un terremoto di magnitudo superiore a 6 corrisponde ad un’allerta che varia da ‘arancio’ a ‘rosso’”.
Nella riproduzione delle condizioni real-time “abbiamo ricostruito il piano di faglia del terremoto di magnitudo 6.4 dopo le prime 24 ore”, prosegue Vannucci, “e poi utilizzato i dati preliminari per iniziare a valutare le variazioni temporali del b-value. Stesso procedimento dopo l’evento di magnitudo 7.1. Il modello ha identificato con successo le due scosse: la prima come foreshock (allerta rossa), la seconda come mainshock (allerta verde)”.
Nel modello è stata anche un’analisi sulla sensibilità del b-value al variare sia della magnitudo di completezza, il valore di soglia minimo per la selezione dei dati, sia del “no-alert-time”, cioè l’intervallo di tempo, immediatamente successivo agli eventi di magnitudo maggiore, nel quale non è possibile ben distinguere sui sismogrammi i numerosi terremoti che si susseguono.
Attraverso una mappatura delle variazioni del b-value, gli autori hanno individuato con successo anche l’area di enucleazione del futuro mainshock del 6 luglio. Dopo tale scossa, infatti, il b-value è aumentato dando un segnale da semaforo ‘verde’, che indicava l’oramai avvenuto mainshock.
L’analisi condotta utilizzando i dati preliminari del network sismico della California è stata ripetuta anche con i dati ad alta risoluzione pubblicati alcuni mesi dopo. I risultati iniziali sono stati confermati consentendo di ridurre sia il no-alert-time sia il valore della magnitudo di completezza.
Ciò ha dimostrato, ai fini dell’applicazione del modello, l’importanza di una fitta rete sismica che renda disponibili raccolte di dati ad alta risoluzione, ovvero con eventi ben localizzati e di piccola magnitudo. Tale modello, allo stato, non è ancora applicabile ovunque nel mondo né per terremoti che avvengono in mare.
*******
The first test on the “Foreshock Traffic Light System” was successfully performed
The first test on the “Foreshock Traffic Light System”, a model developed by Laura Gulia and Stefan Wiemer (Swiss Seismological Service, SED), was successfully performed. The model can statistically interpret in a predictive manner the variation of the b-value, that is, the relationship between earthquakes frequency and magnitude based on systematic analysis of seismic sequences occurring all over the world, to provide a real-time response based on an alert code (defined by the colors green, orange and red).
The test, recently published in Seismological Reseach Letters (‘Pseudoprospective Evaluation of the Foreshock Traffic-Light System in Ridgecrest and Implications for Aftershock Hazard Assessment’), was performed by SED and University of Bologna in collaboration with Gianfranco Vannucci from the Italian National Institute of Geophysics and Volcanology (INGV), and took place through the implementation of the near-real-time model to the Californian seismic sequence of Ridgecrest in July 2019.
INGV provided support in the initial stages of the sequence analysis through the reconstruction of the possible seismogenic sources of the two main events: the magnitude 6.4 earthquake of July 4th, 2019 and the subsequent mainshock, or the main seismic event, of magnitude 7.1 on July 6th, 2019.
“We analyzed the spatio-temporal variations on the b-value fault plane – explains Gianfranco Vannucci, INGV researcher who collaborated on the study – A decrease in bvalue after an earthquake of magnitude greater than 6 corresponds to an alert that varies from ‘orange’ to ‘red’. The analysis was carried out “a posteriori” but reproducing the realtime conditions: we reconstructed the fault plan of the magnitude 6.4 earthquake after the first 24 hours and then we used the preliminary data to start evaluating the temporal variations of the b-value, as well as after the magnitude 7.1 event”.
The model has successfully identified the first shock as a foreshock (red alert), and the second one as the mainshock (green alert). “An analysis of the sensitivity of the b-value – adds Vannucci – has also been introduced in the model. This analysis concerns the variation of both the completeness magnitude (a parameter for selecting the data useful for calculating the b-value) and the ‘no-alert-time’ (the time interval, immediately following the events of greater magnitude, in which it is not possible to define an alert level)”.
By mapping the changes in the b-value, the authors also successfully identified the area of the enucleation of the future July 6th mainshock. After this shock, in fact, the b-value increased giving a ‘green’ traffic light signal, which indicated that the mainshock had now taken place.
The analysis carried out with preliminary data from the California seismic network was finally repeated with the high-resolution data reanalyzed, which confirmed the initial results, allowing to reduce both the no-alert-time and the value of completeness magnitude.
This has demonstrated, for the purposes of applying the model, the importance of a dense seismic network that makes high-resolution dataset available, that is, with well-localized and small-magnitude events. At present, this model is not yet applicable everywhere in the world or for earthquakes that occur at sea.
 Salva come PDF